
Usage, costs, and access
Read credit balances, investigate consumption, and distinguish actual charges from estimates.
Use Usage to understand what the workspace consumed and Billing for its funding state. Use workflow Analytics and History to explain the executions behind those totals. These views answer different questions: a credit total does not tell you whether a particular browser task returned the right result.
Set the workspace and time window
Open Usage from the sidebar. Choose the scope offered above the cards: an All view, the organization, or an individual workspace. Then choose 7d, 30d, or 90d.
Keep both selections fixed when comparing figures. A 30-day organization total includes a different population from a 7-day workspace total. Wait for the view to finish updating after changing a filter before drawing a conclusion.
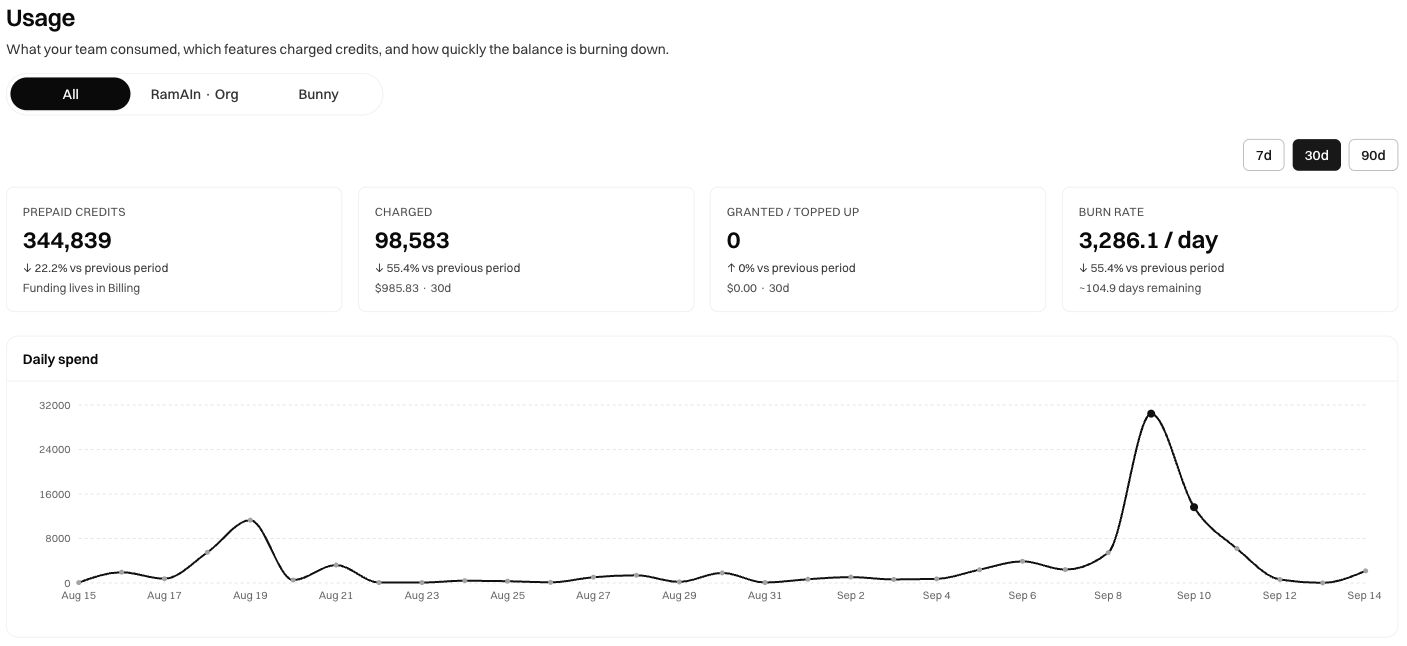
Read the four cards
A positive balance alongside 0 granted in the period can be normal: the account may have been funded before that window. Likewise, a high balance does not imply low recent usage. Read Charged and Burn rate for that question.
An estimated 100 days remaining does not reserve 100 days of service. More runs, longer sessions, or additional authoring can change future consumption. An absent estimate is different from a promise of unlimited time.
Investigate a spike
The Daily spend chart shows consumption over time. Start with the unusual date, then use Consumption by feature to understand which category accounts for the credits. Categories can include AI usage, workflow execution, and browser automation.
Follow the question back to the operational evidence:
- Keep the same workspace and date range.
- Identify whether the increase came from more executions, longer executions, or authoring activity.
- Open the relevant workflow or session history for that period.
- Compare actual outputs and the repeated steps. A cheap incorrect run is not an improvement.
- If the task repeatedly navigates the same pages, review Optimize; if it repeatedly recovers from a changed page, review Drift.
Feature totals describe consumption categories. They are not individual invoice line items or proof that a particular model choice caused the change. Use the detailed view available to your role before attributing a spike.
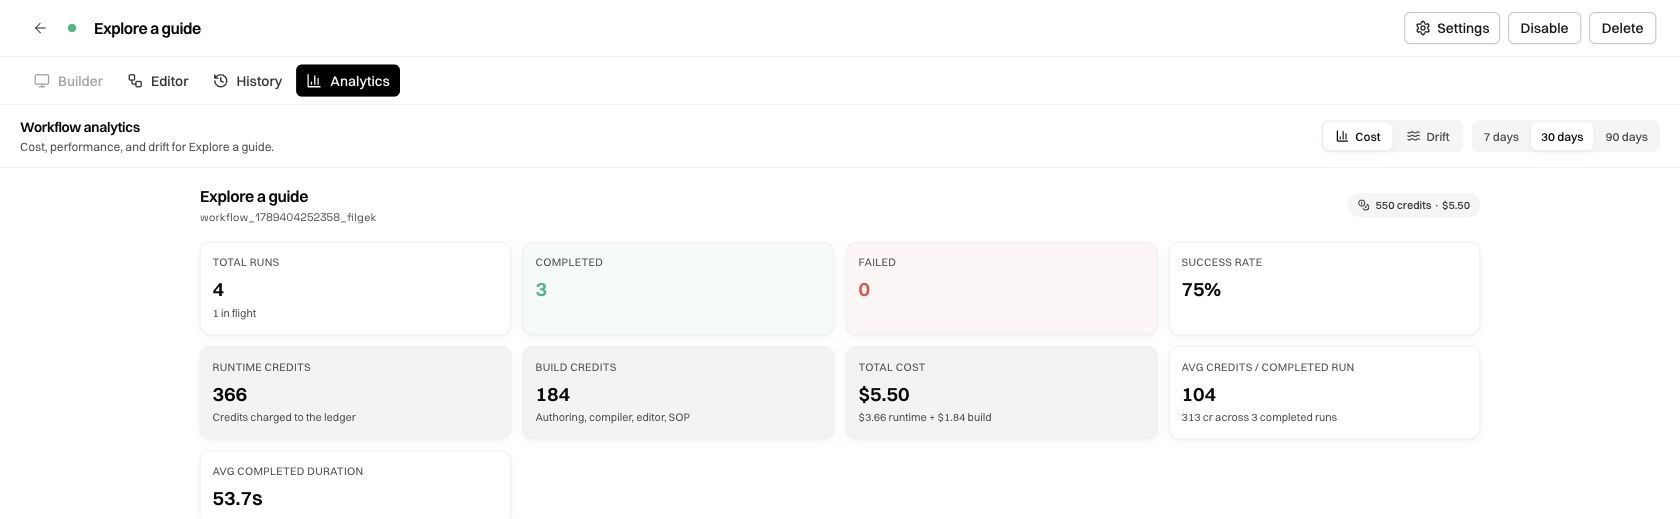
Read averages from completed runs
Workflow and Agent analytics distinguish total consumption from average cost per completed run. Total runtime consumption includes work that failed, stopped, or is still running. The average uses only completed executions and their runtime credits.
For example, suppose two completed runs used 20 and 40 credits, a failed run used 90, and building the workflow used 200. Runtime consumption is 150 credits, build consumption is 200 credits, and the average per completed run is 30 credits: (20 + 40) ÷ 2. The failed run and build costs do not enter that average.
When there are no completed runs, the average is unavailable rather than zero. A zero would suggest that completed work was free; an unavailable value means there is no completed baseline yet.
Node and model-family averages use completed executions that actually used that node or family. A child workflow's average uses completed child launches. Hourly rates pair the same completed executions' spend with their recorded duration. Authoring, compilation, Editor chat, and SOP generation remain separate build spend.
Compare the four RamAIn model families
Tokens & models groups model activity into four families:
Provider alternatives within one family are combined. If a run used two providers from the same family, it still counts once in that family's run count. Internal or unclassified model activity is shown as separate overhead and remains included in overall consumption; it is not assigned to a guessed family.
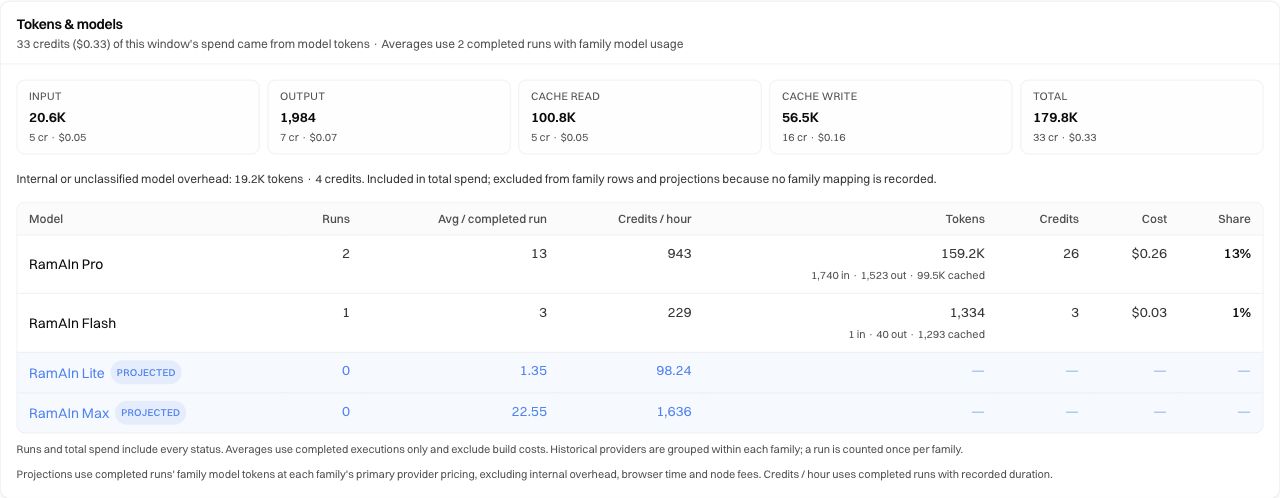
A projection reprices the mapped model-token workload from completed runs using the target family's primary configured model. It does not choose a cheaper alternative based on credential availability or fallback order. If the primary model has no configured price, that projection is unavailable. Internal model overhead and browser or other non-model charges are excluded from this repricing baseline.
Use projections to decide what to test next. Run representative inputs with the proposed model and compare the actual result, recovery behavior, duration, and runtime credits. The workflow's selected model can affect input parsing as well as browser actions; Workflow settings explains that choice.
Understand which cost details your role can see
Credits and credit rates remain the normal usage measures. Internal dollar-cost columns, cards, labels, and tooltips are visible only to dev-admin. Workspace Admin, Builder, and User roles do not receive those dollar breakdowns. A missing dollar column is an access rule, not a missing execution or a zero-cost run.
The example screenshots show a dev-admin's view. Readers with other roles should compare the credit figures available to them and use Billing for their account's funding and commercial information.
When credits block a run or chat turn
Read the reported reason first. Insufficient credits, an outstanding balance policy, and a missing billing entitlement can require different action. Open Billing in the correct scope and ask the authorized billing administrator to resolve the account state.
If a launch was rejected, check whether a run was actually created before trying again. If a run exists, inspect it in Sessions. Repeatedly selecting Launch while a page is slow can create additional executions once the request succeeds.
After funding is resolved, retry the intended action and verify its status. A billing change does not retroactively turn an earlier failed execution into a successful one.
Resolve confusing totals
For plan or contract questions, use the current Billing information and contact RamAIn. Workspace and team explains scope and role management.
Was this page helpful?